What the studies covered
This page brings together two substantial classification studies and a visual algorithm archive. The MNIST project builds an inspectable k-means digit classifier from scratch. The wine study compares model families on an imbalanced dataset and shows why per-class performance matters. Supporting notebooks make concepts such as learning rate, margin, regularization, and model capacity visible.
SYSTEM ARCHITECTURE
MNIST centroid classifier
28 × 28 image → 784-vector → k-means (k = 26) → nearest centroid → digit label + outlier flagThe complete pipeline—from centroid initialization and assignment to labeling and outlier detection—was implemented directly in MATLAB so every stage could be inspected and plotted.
Wine-quality comparison
11 physicochemical features → EDA / PCA / imbalance treatment → RF, SVM, ANN, logistic regression → per-class metricsExploratory analysis established the class imbalance and feature structure before several classifier families were compared on original and rebalanced training data.
Visual algorithm studies
controlled dataset → implemented method → diagnostic plotFocused notebooks isolate how step size, regularization, decision boundaries, polynomial degree, and network width change a model's behavior.
How the models were evaluated
- STAGE 01
Build and test the MNIST baseline
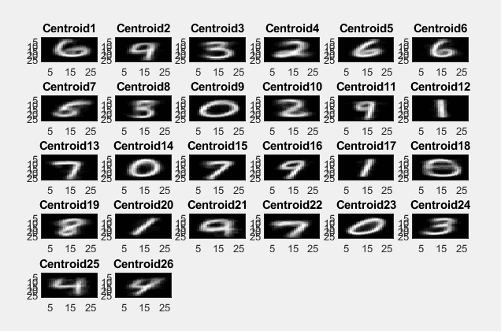
Implemented k-means on 1,500 flattened MNIST images, assigned digit meanings to 26 learned centroids, and classified a 200-image test set.
- STAGE 02
Understand the wine dataset
Explored 1,599 red-wine samples with feature distributions, a correlation heatmap, PCA, and univariate scoring before training classifiers.
- STAGE 03
Compare models under class imbalance
Compared random forests, SVMs, multilayer perceptrons, and logistic regression across original and rebalanced variants, then checked per-class performance on a held-out test set.
- STAGE 04
Visualize the underlying algorithms
Built focused notebooks showing how learning rate, polynomial degree, separability, SVM regularization, and network width affect fitted models.
Key modeling decisions
Keeping the MNIST baseline interpretable
K-means made the complete classification path visible, but its result depended on a manually chosen k and centroid initialization. The 73.5 percent score represents one documented baseline run, not an optimal digit recognizer.
Looking beyond aggregate accuracy
Wine-quality classes 5 and 6 dominated the dataset. The selected random forest reached 70 percent accuracy, yet several rare classes still had zero precision and recall, making the per-class report more informative than the headline score.
Understanding what rebalancing changes
Oversampling, undersampling, and SMOTE improved some minority-class results while changing the training distribution and sometimes reducing performance on the original test distribution.
What the experiments showed
- The MNIST baseline correctly labeled 147 of 200 test images (73.5 percent), with learned-centroid images, a convergence curve, prediction overlays, and 11 flagged outliers.
- Wine-quality analysis visualized feature correlations and PCA class overlap before any classifier was selected.
- The selected random forest reached 70 percent accuracy on a 320-sample test split, while its class report exposed weak performance on rare quality scores.
- The supporting plots demonstrate gradient descent, least squares, perceptrons, RBF SVMs, neural-network capacity, and polynomial underfitting and overfitting.
What I took from them
A transparent baseline made the MNIST errors inspectable, even though a more advanced classifier could achieve higher accuracy.
The wine study showed why aggregate accuracy must be read alongside class balance, precision, recall, and the test distribution.
Focused visual experiments made abstract choices such as step size, regularization, margin, and model capacity easier to reason about.