The work
This collection shows how I moved between circuit theory, simulation, and physical measurement. The work progressed from verifying a resistive-network equivalent to designing op-amp functions, testing an amplifier across frequency, and comparing passive-filter predictions with real bench data.
SYSTEM ARCHITECTURE
Measure the fundamentals
breadboard network → Thevenin reduction → DMM verificationA resistive network was reduced analytically, rebuilt on a breadboard, and checked with a DMM to confirm that the simplified model preserved its terminal behavior.
Move from simulation to hardware
Multisim op-amp family → physical UA741 → frequency sweepI created simulation schematics for several amplifier functions, then helped build and characterize an inverting amplifier across a wide frequency range.
Compare filters and transistor behavior
RC / RL / RLC filters + PSpice inverter studiesPassive-filter sweeps connected cutoff equations to simulated and measured responses, while supporting transistor studies examined switching and amplification at the device level.
What I built and tested
- STAGE 01
Verify the network
Built and measured a resistive network, then verified its Thevenin equivalent with a bench DMM.
- STAGE 02
Simulate the op-amp family
Created Multisim schematics for inverting, non-inverting, difference, instrumentation, follower, and comparator circuits.
- STAGE 03
Test the physical UA741
Assembled a physical UA741 inverting amplifier and measured its closed-loop response across six decades of frequency.
- STAGE 04
Compare passive filters
Designed and simulated RC, RL, and RLC filters, then compared selected cases with physical transfer-function data.
Bench realities
Measurements require instrument awareness
A noisy input trace and an incorrect oscilloscope setting distorted one amplifier measurement. Comparing the scope, function generator, calculations, and simulation helped isolate the issue instead of treating every displayed value as ground truth.
Hardware exposed behavior the schematic did not
The physical amplifier lost gain at higher frequencies, and component choices shifted some measured filter responses away from their simulations. Those differences made bandwidth, tolerance, wiring, and setup part of the analysis.
Selected results
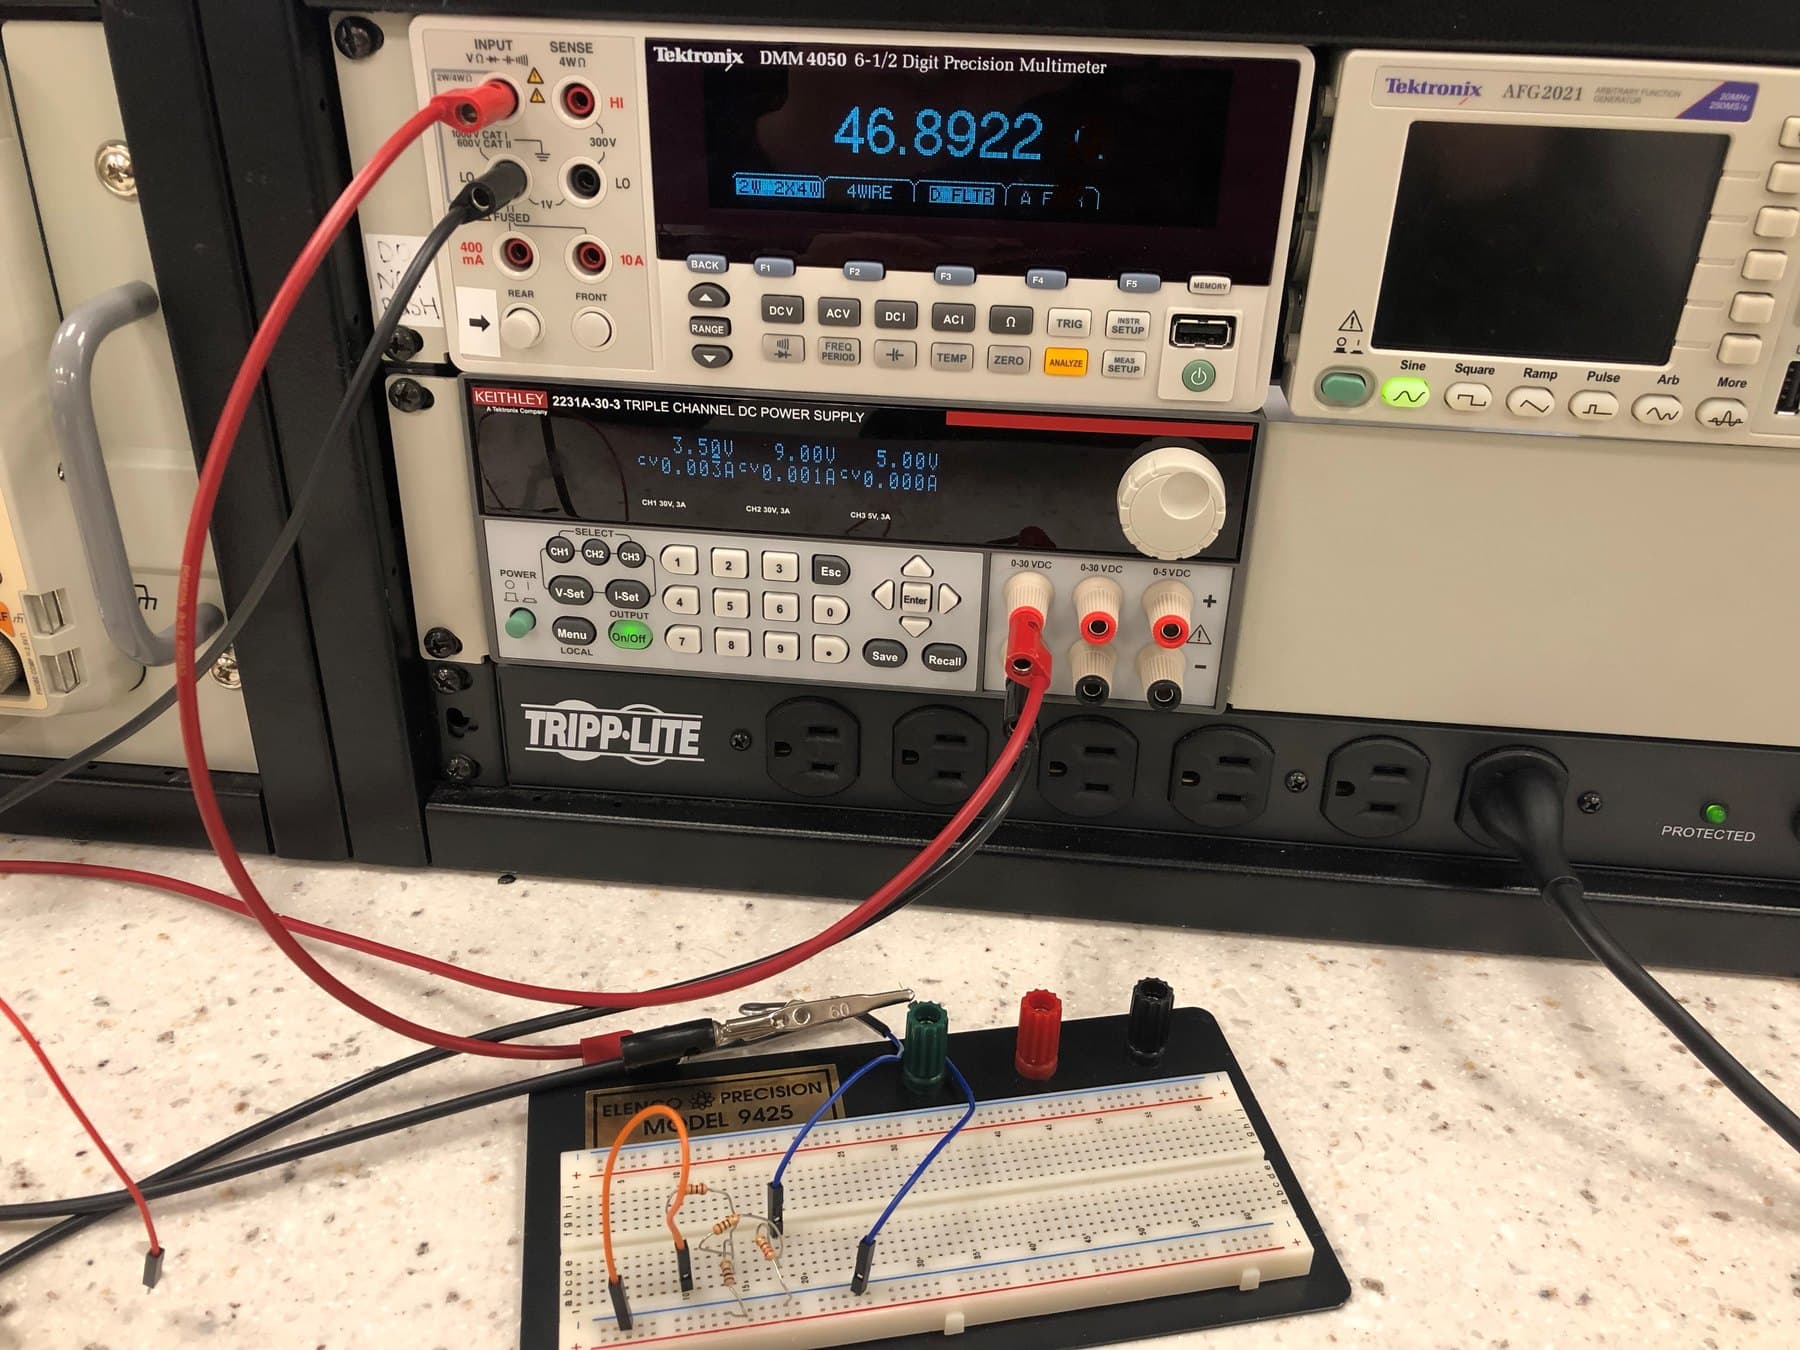
- The Thevenin resistance measured 46.89 Ω against 47.14 Ω calculated—a 0.53% difference.
- The simulated op-amp circuits reproduced the expected inversion, amplification, buffering, difference, and comparison behavior.
- The physical amplifier held a midband gain near 36.5 before rolling off around 10 kHz; the closest filter simulation matched its theoretical cutoff within 0.08%.
Takeaway
Bench work made the instruments, wiring, and component choices part of the system rather than background details.
A clean simulation and a messy measurement can both be useful when the source of the mismatch is documented honestly.
Selected reports
Thevenin resistive-network report
Individual bench study of node voltage, superposition, and a network equivalent measured at 46.89 Ω and 1.36 V.
UA741 frequency-response experiment
Physical inverting UA741, measured parts, noisy scope capture, practical KCL model, and closed-loop gain from 1 Hz to 1 MHz.
Passive-filter simulations
Seif’s Multisim AC sweeps for RC/RL low-pass, high-pass, band-pass, and RLC band-stop filters, with cutoff percent errors.